Getting Started
Find Nuclei Viewer is a browser-based viewer for OME-ZARR microscopy data. It runs entirely in your browser — no installation, no file uploads, no account required. Open local files or remote URLs and start exploring in seconds.
Open Local Data
The fastest way to get started is to drag and drop a local OME-ZARR folder directly into the browser.
- Go to find-nuclei.github.io
- Open your file manager (Finder on macOS, Explorer on Windows)
- Drag your
.ome.zarrfolder onto the browser window - The drop overlay appears — release to open
Your data stays on your machine. Nothing is uploaded anywhere.
Supported Formats
Find Nuclei Viewer supports OME-ZARR (OME-NGFF) format, versions 0.4 and 0.5, including sharded stores. Both single images and HCS plates are supported.
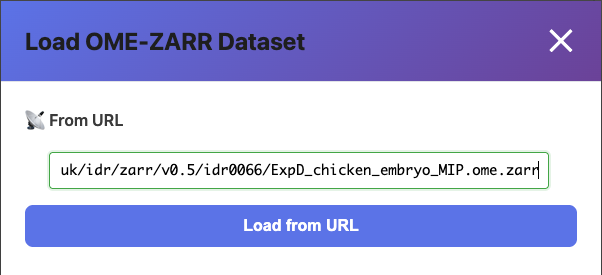
Open Remote Data
You can also open OME-ZARR datasets hosted on public servers like the Image Data Resource (IDR).
- Click the Open Image button on the landing page
- The Load Data modal opens
- Paste an OME-ZARR URL into the URL field (e.g., from IDR)
- Click Load from URL
The viewer streams tiles directly from the remote server — no download required.
Open an Example
Not sure where to start? Click Open Example on the landing page to browse curated public datasets from the IDR.
Navigate Your Image
Once your image is loaded:
| Action | Control |
|---|---|
| Zoom in/out | Scroll wheel |
| Pan | Click and drag |
| Reset view | Double-click |
The viewer uses GPU-accelerated multi-resolution tile rendering via deck.gl WebGL — zoom in and higher-resolution tiles load automatically. It handles images over 100,000 pixels wide.
Channel Controls
Microscopy images often have multiple fluorescence channels. The channel panel on the right lets you:
- Toggle channels on/off with the visibility checkbox
- Change channel color by clicking the color swatch
- Adjust contrast using the min/max sliders
- Auto-contrast — one-click percentile-based (2%–98%) intensity optimization per channel
- Per-channel histograms — see the intensity distribution for each channel
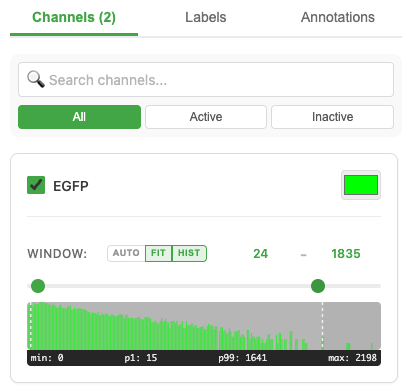
All channels blend in real time using GPU-accelerated rendering.
Z-Stack Navigation
If your image has multiple Z-slices, a Z-slider appears below the viewer. Drag it to navigate through the focal planes.
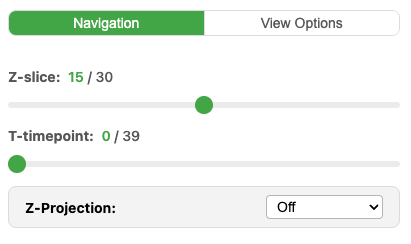
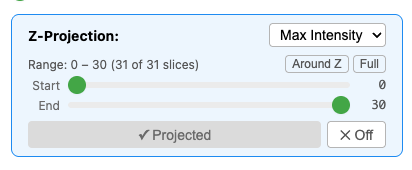
Z-Projection
For 3D datasets, the viewer supports intensity projections:
- Max projection — maximum intensity across the Z-range
- Mean projection — average intensity
- Min projection — minimum intensity
You can configure the Z-range for partial projections.
Segmentation Overlays
The viewer can display segmentation labels (masks) alongside your image data.
- Labels stored inside the OME-ZARR are detected automatically
- Toggle label visibility in the Labels panel
- Adjust label opacity with the slider
- Each label instance gets a unique color
- Drag-to-reorder label layers for rendering priority
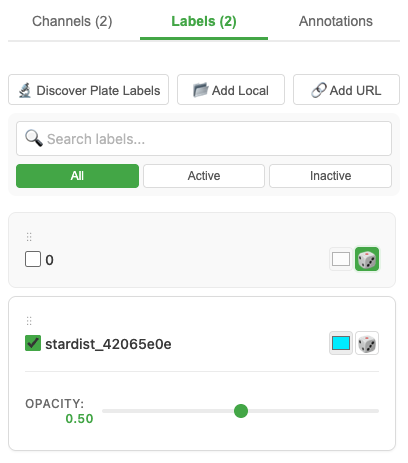
You can also link external label stores using the Link Label button — load labels from your local disk or a remote URL.
HCS Plates
Find Nuclei Viewer has full support for High-Content Screening (HCS) plate data — any plate format (96, 384, 1536-well, or custom layouts).
- Field View — Opens showing the first field of the first well
- Grid View — Click Show All Fields to see all fields in the current well laid out in a grid
- Plate View — Click Show Full Plate to see the entire plate overview with all wells
- Seamless zoom — zoom smoothly from plate overview all the way down to individual cells
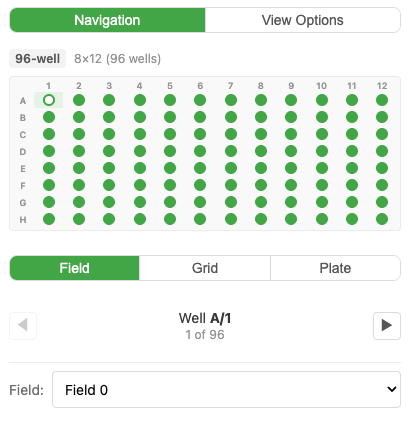
Navigate between views by clicking wells in the plate overview. Channel settings apply plate-wide.
Share a View
When viewing a remote (URL-based) dataset, the URL tracks your view state in real time — like Google Maps:
- Set up your view — zoom to a region, adjust channels and colors
- Click the 🔗 Link button in the toolbar
- A shareable URL is copied to your clipboard
- Send the link — the recipient sees the exact same view (zoom, position, channels, colors)
The link works in any modern browser. No install needed for your collaborators.
Live Examples
Click any link to open directly in the viewer:
| Example | Description |
|---|---|
| Zebrafish Lateral Line | 3D multi-channel with labels |
| HCS Plate (v0.5) | Multi-well plate, 5 channels |
| Large Image (144K×93K) | 144K×93K pixels, multi-resolution |
All datasets from the Image Data Resource (IDR).
What's Next?
Open and organise
- Local Files Guide — Deep dive into local file workflows
- Remote URLs Guide — Working with public and private Zarr stores
- Data Server Guide — Host your own on-site Zarr server with Docker
- HCS Plates Guide — Plate navigation and multi-well analysis
Share and embed
- Sharing Guide — URL sharing and collaboration
- Embedding Guide — Drop the viewer into any web page with two lines of HTML