Channels
A channel is one fluorescence wavelength, one brightfield layer, or any other intensity stream captured during imaging. Most microscopy datasets have between two and twelve channels; the viewer blends them in real time on the GPU so you can pick which ones to see, in which colors, at which contrast.
This guide covers every control in the Channels panel: colors, contrast, gamma, auto-contrast, and the display toggles (RGB, BW, INV).
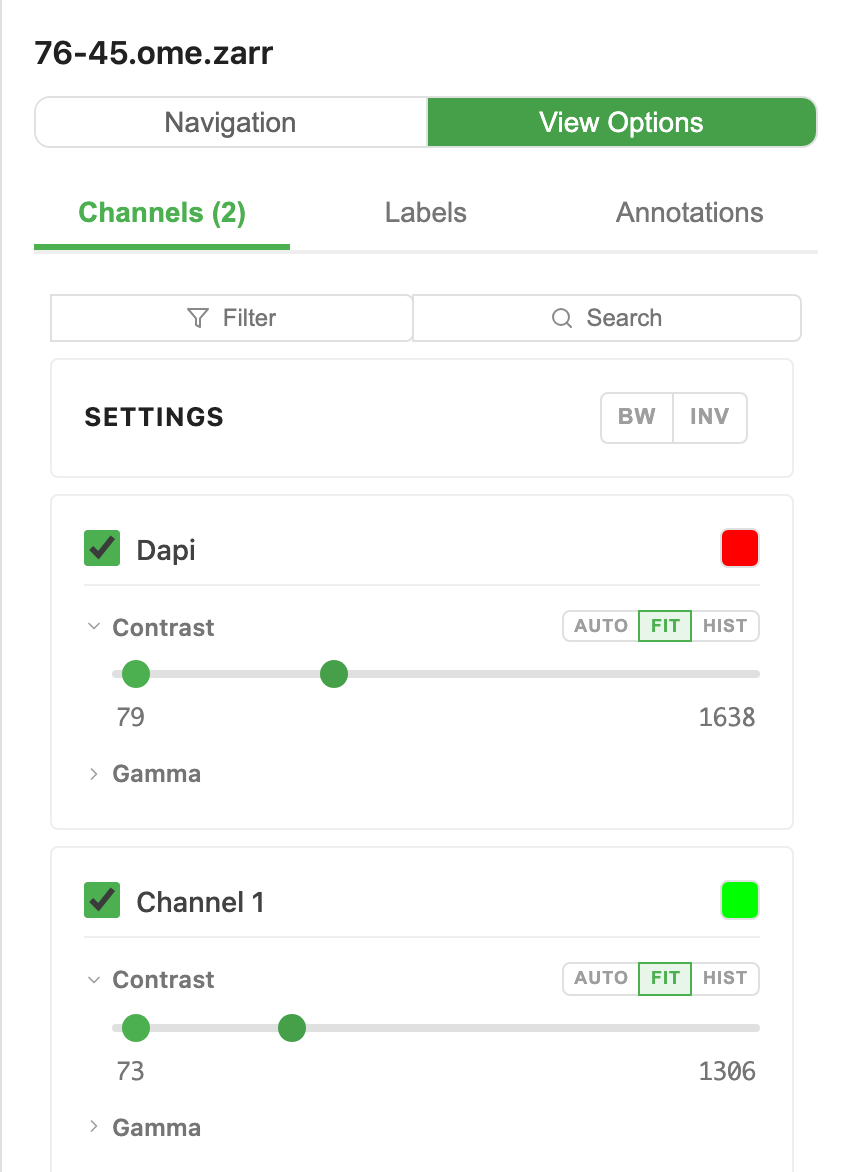
The Channels panel
Each channel takes one card. Cards stack vertically in the order the channels are stored in the OME-Zarr metadata. That order typically matches the acquisition order.
Each card shows:
 toggle: turn the channel on or off
- Channel name, e.g.
DAPI,GFP,Cy5 - Color swatch: click to open the ColorPicker popover (presets + hex + RGB + native OS picker)
- Contrast section: dual-range slider showing min/max intensity clip points
- Gamma section (collapsible): gamma curve slider for non-linear contrast shaping
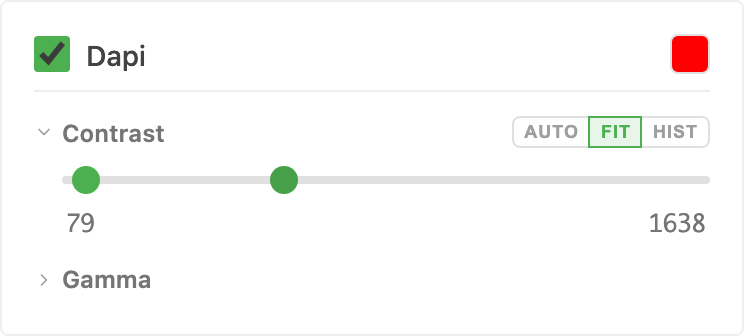
Channel colors
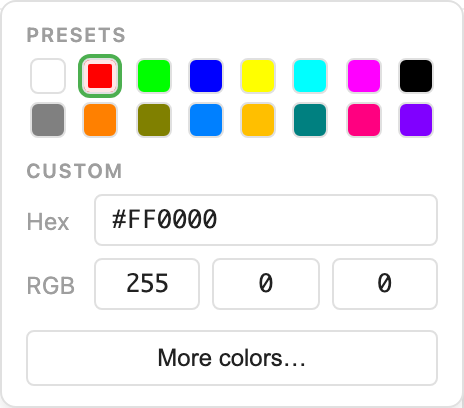
Click the color swatch on a channel to open the picker. Two rows of presets curated for fluorescence microscopy:
- Row 1 (bright saturated): White, Red, Green, Blue, Yellow, Cyan, Magenta, Black
- Row 2 (microscopy-friendly): Gray, Orange (mCherry), Olive, Sky blue (DAPI), Amber (YFP), Teal, Pink, Purple (DRAQ5 / far-red)
The bottom row sits next to the top row column-by-column so you can pick either the "mathematically pure" hue or the "nicer-for-composites" variant without re-hunting.
Under Presets the popover also has Hex and RGB inputs synced bidirectionally, and a More colors… button that opens the OS-native picker (Chrome / Edge also get the eyedropper for sampling colors from the image itself).
Colour matching across surfaces
The same preset palette drives channel colours, label solid mode, and annotation colours. Picking "Green" on a channel gets the same hex as picking "Green" on an annotation. If you later want a colour-blind-safe palette, every surface flips together.
Contrast: the dual slider
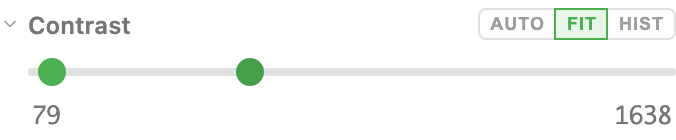
The Contrast section is a dual-range slider over the channel's intensity histogram. The left handle sets the intensity that maps to black; the right handle sets the intensity that maps to the channel's color at full saturation. Everything below the left handle clips to black; everything above the right handle saturates.
Underneath the slider: two number labels at the ends showing the current min / max values, and three tiny action buttons that appear on hover or when the slider is expanded:
| Action | Effect |
|---|---|
| AUTO | Compute percentile-based auto-contrast (2nd–98th percentile by default). Runs a fast histogram pass over the currently-loaded tile data and sets min/max to fit. One click per channel. |
| FIT | Set min/max to the exact data range (0th–100th percentile). Useful for 16-bit data where most pixels are near zero but you want to see the full range anyway. |
| HIST | Toggle the histogram visualisation. When on, the slider sits over a mini histogram of the channel's intensity distribution. Useful for deciding where to set the clip points. |
Typing exact values
Click either of the min/max labels below the slider. They turn into number inputs. Type a value and press Enter. The slider snaps to the typed value. Useful when you want to match the contrast from a publication, a teammate's view, or a previous session.
When to use auto vs manual
- Auto-contrast is the right default for most data. It clips extreme outliers and stretches the middle 96% across the full brightness range.
- Manual when you need to compare two images with the same range (e.g., before/after treatment), or when auto over-compresses signal in a specific area you care about.
- Fit rarely does what you want on 16-bit data. The full dynamic range usually has too many dim pixels for the signal to show. Still useful for 8-bit or already-normalised data.
Gamma: non-linear contrast
Gamma bends the intensity-to-brightness mapping so dim details come up (gamma < 1) or bright details get compressed (gamma > 1). The Gamma section is collapsed by default; click the chevron to expand it.
Range is 0.1–3.0; default 1.0 (linear mapping). Typical useful range: 0.5 for "brighten dim detail" to 1.5 for "tone down bright regions".

Gamma on quantitative data
Gamma distorts the intensity-to-brightness mapping. Fine for visual inspection, misleading for quantitative comparisons. If you're going to publish the image, note the gamma setting in the figure caption (or set it back to 1.0 before screenshotting).
Display modes: RGB, BW, INV
The SETTINGS row at the top of the Channels panel has three toggles:
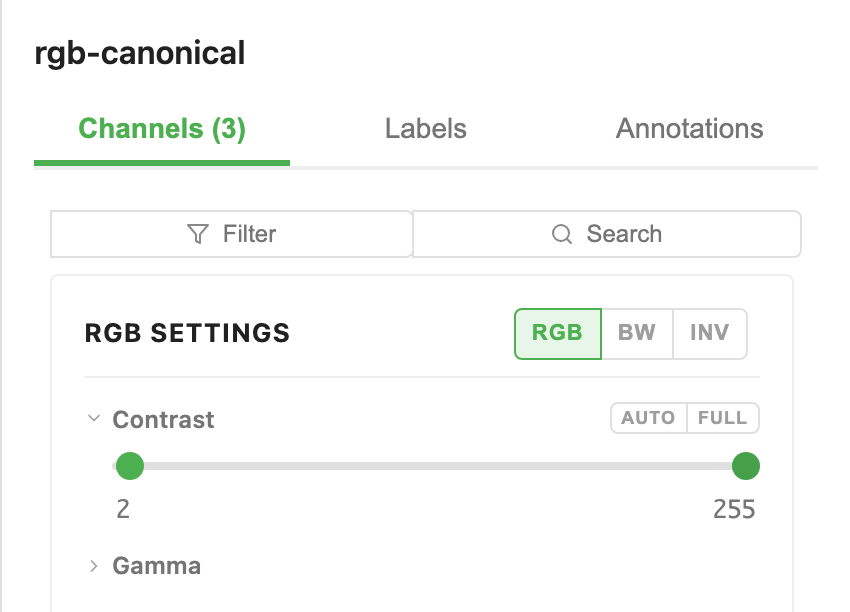
RGB: linked sliders
RGB gives a true-colour image one contrast slider instead of three. The channel colour pickers lock to red, green and blue.
It does not change how the image looks. The viewer recognises true-colour data on its own and shows it correctly from the moment you open it. RGB only controls whether you adjust the three channels together or separately, which is why the button appears on those images and nowhere else.
Use RGB for:
- True-color images (brightfield RGB captures, histology with R/G/B)
- Linked adjustment when your three channels share a meaningful intensity range
Turn RGB off to get back per-channel controls.
BW: black-and-white mode
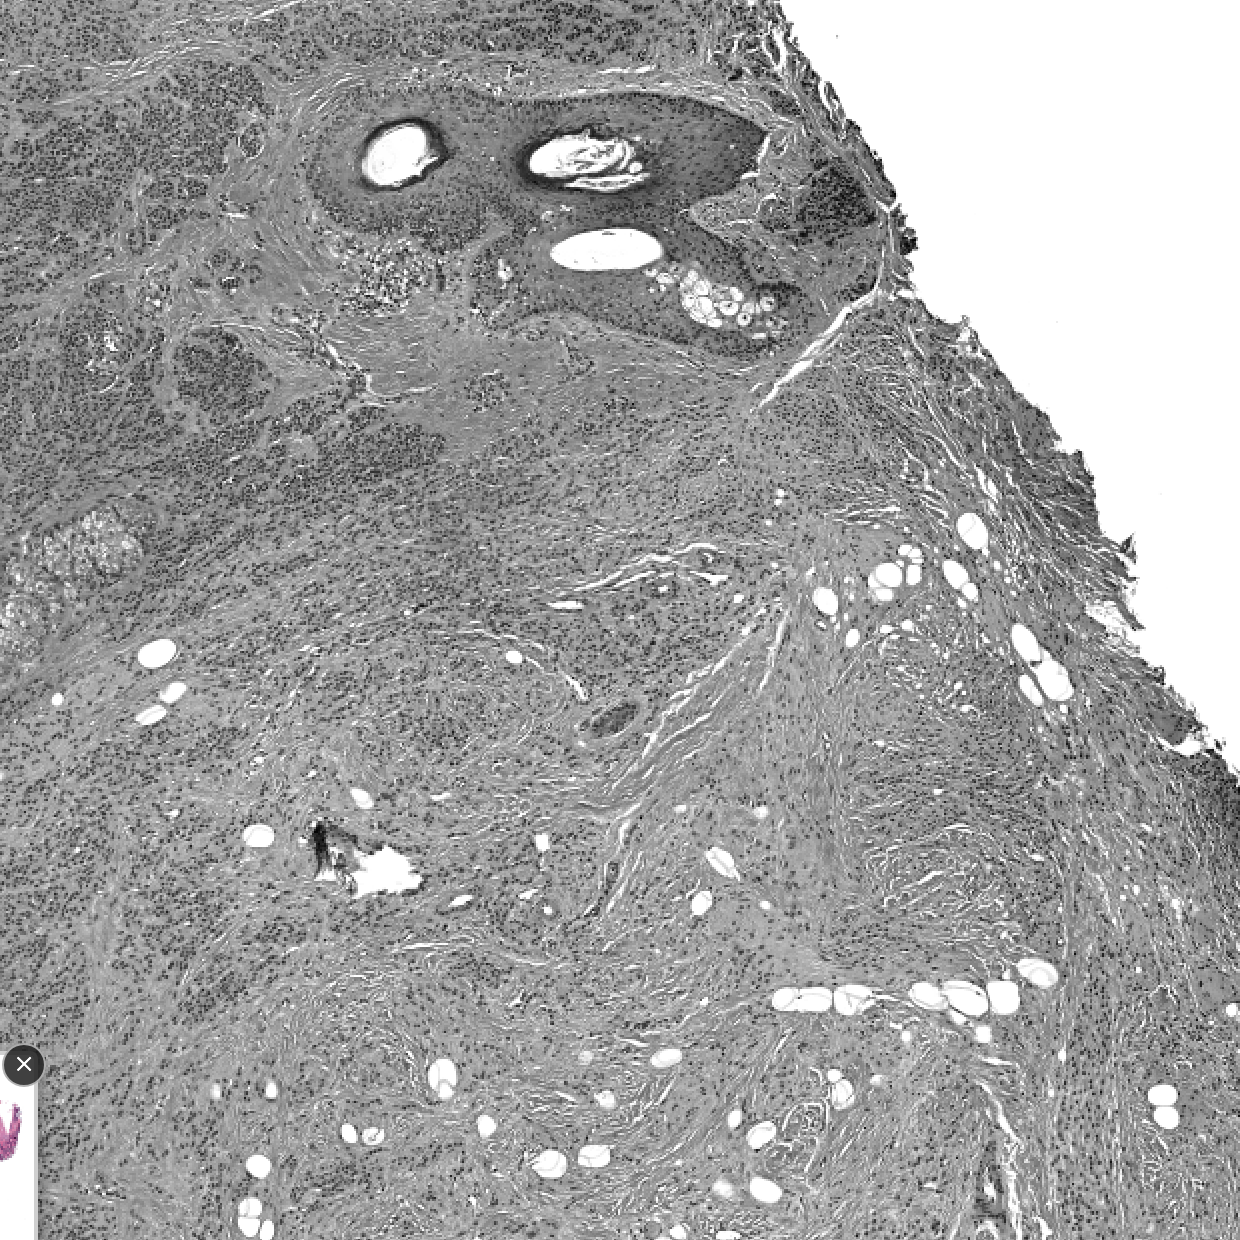
Force every visible channel to grayscale, ignoring their colors. Each channel still has its own contrast slider. BW just swaps the final blend to grayscale intensity.
Use BW for:
- Single-channel inspection when you want maximum perceptual detail (human eyes resolve intensity better than color)
- Comparing channels side-by-side without color biasing the interpretation
INV: invert
INV puts the image on a white background.
What you get depends on the data.
Fluorescence keeps its colours. A channel set to blue stays blue and draws on white instead of black. Where two channels overlap, their colours mix darker, the way overlaid inks do.
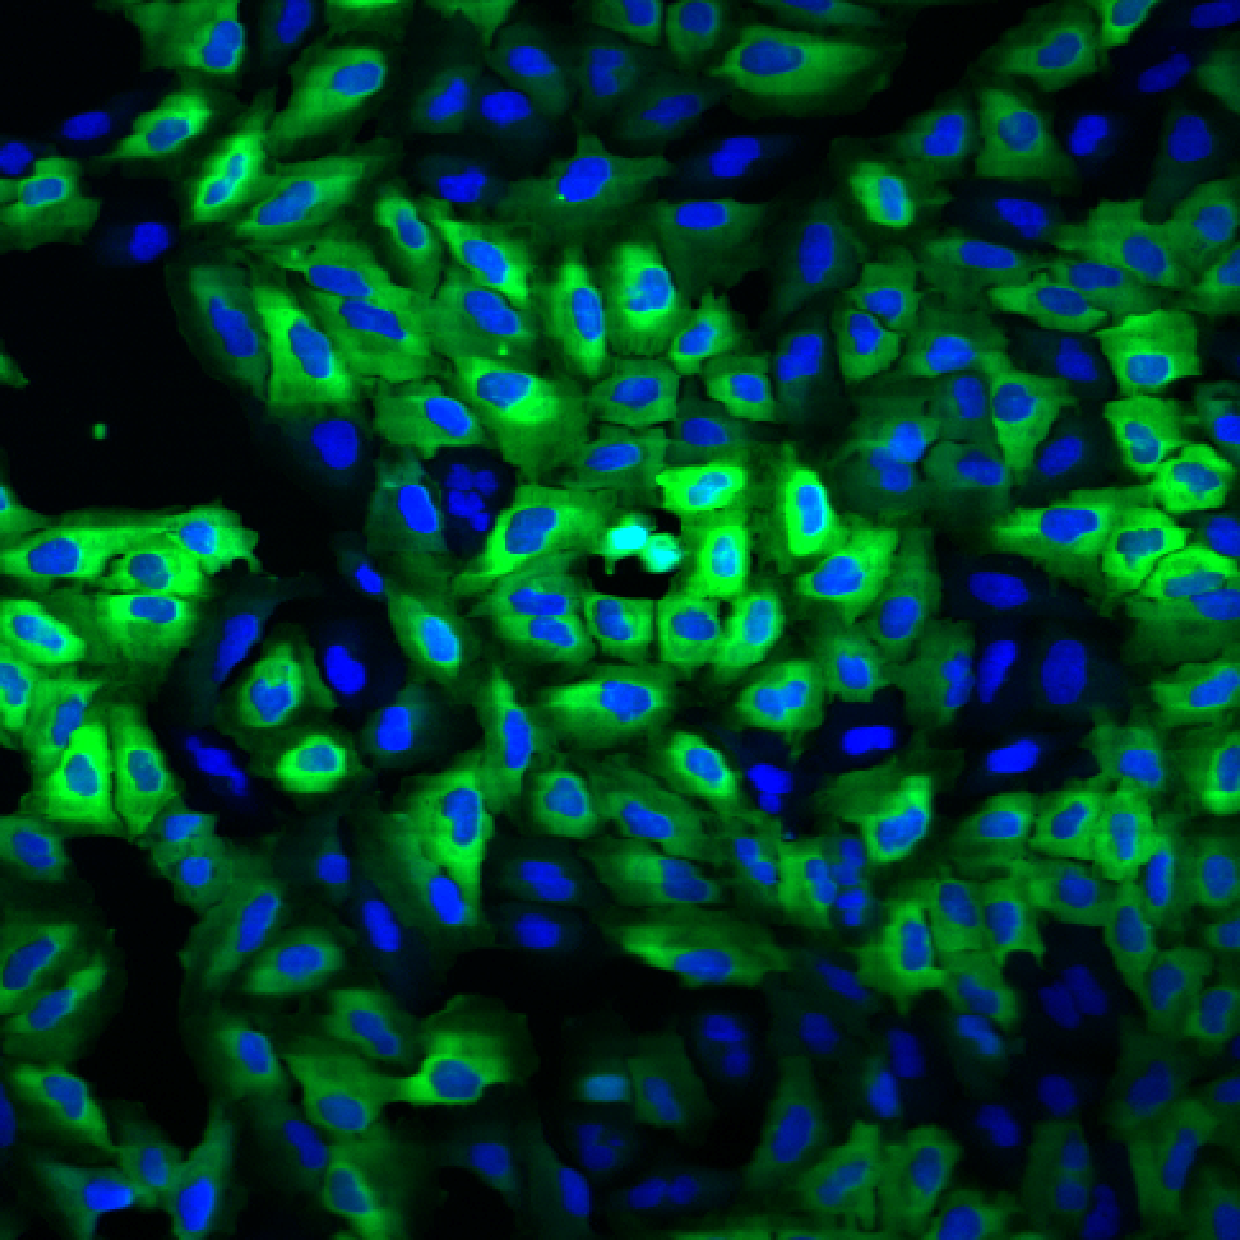
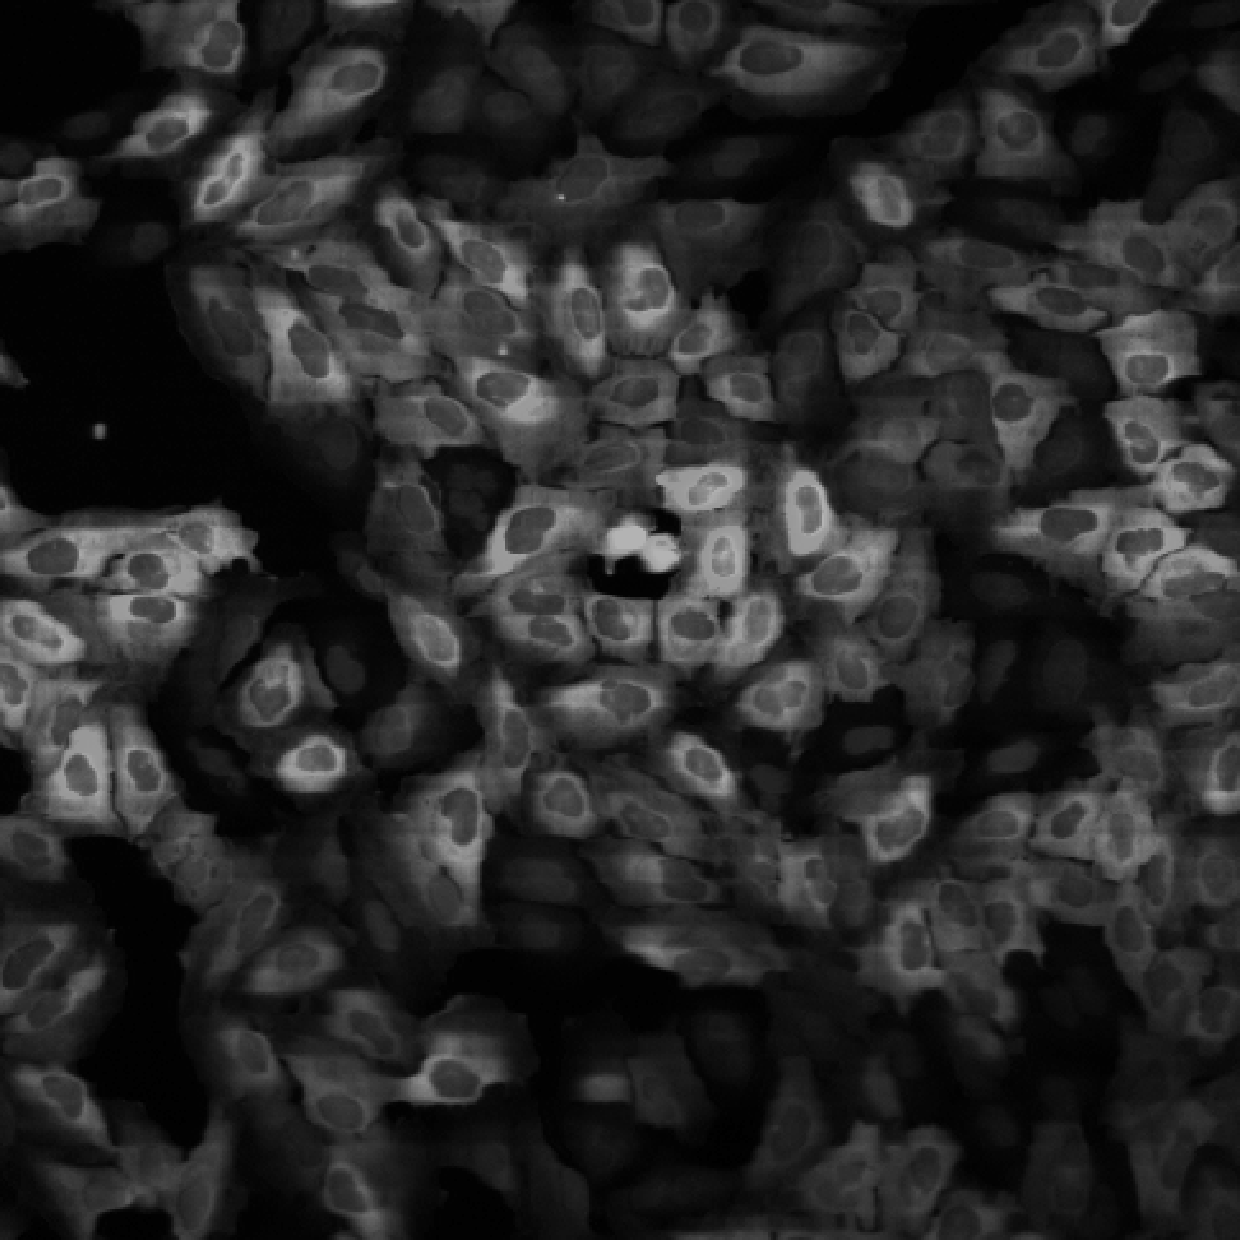
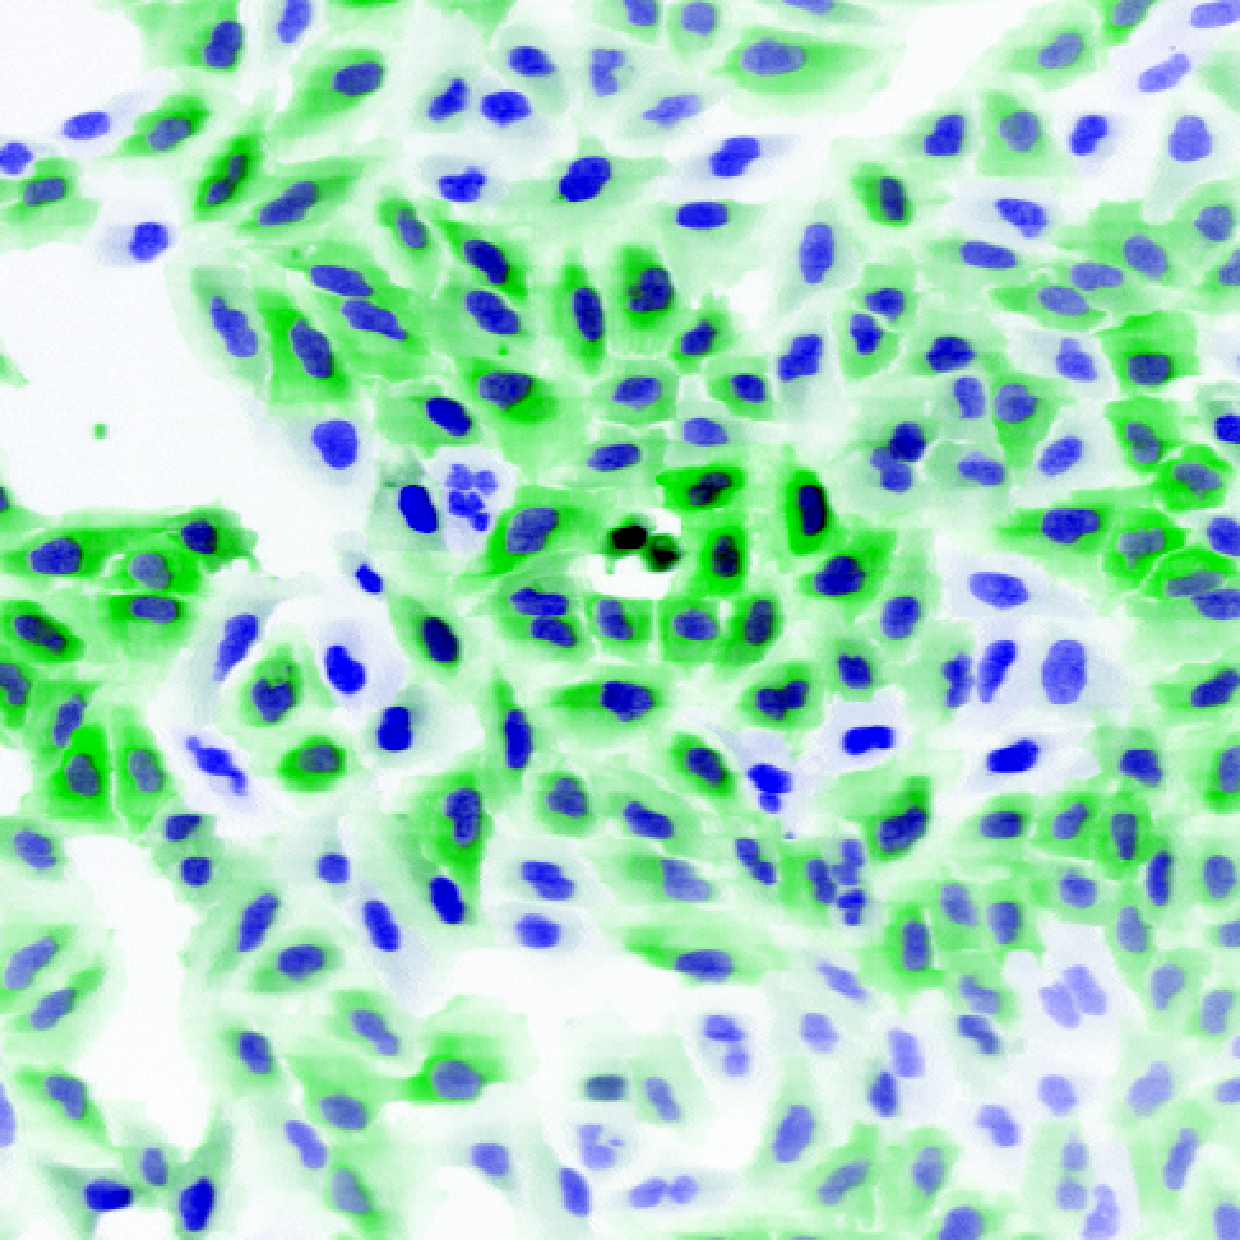
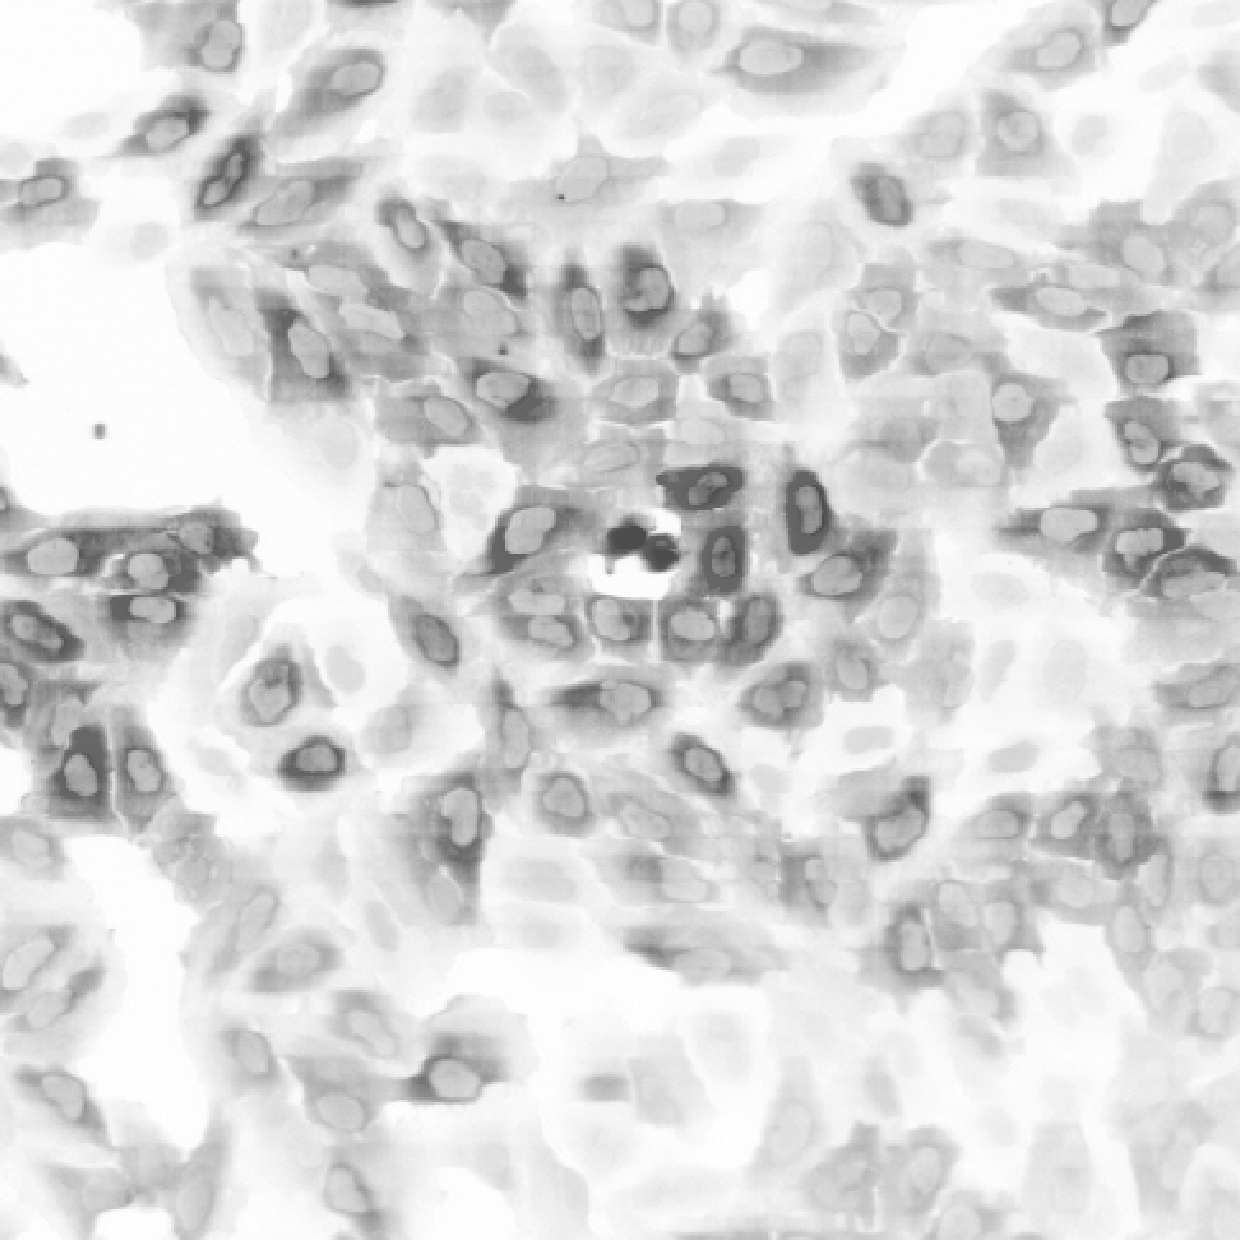
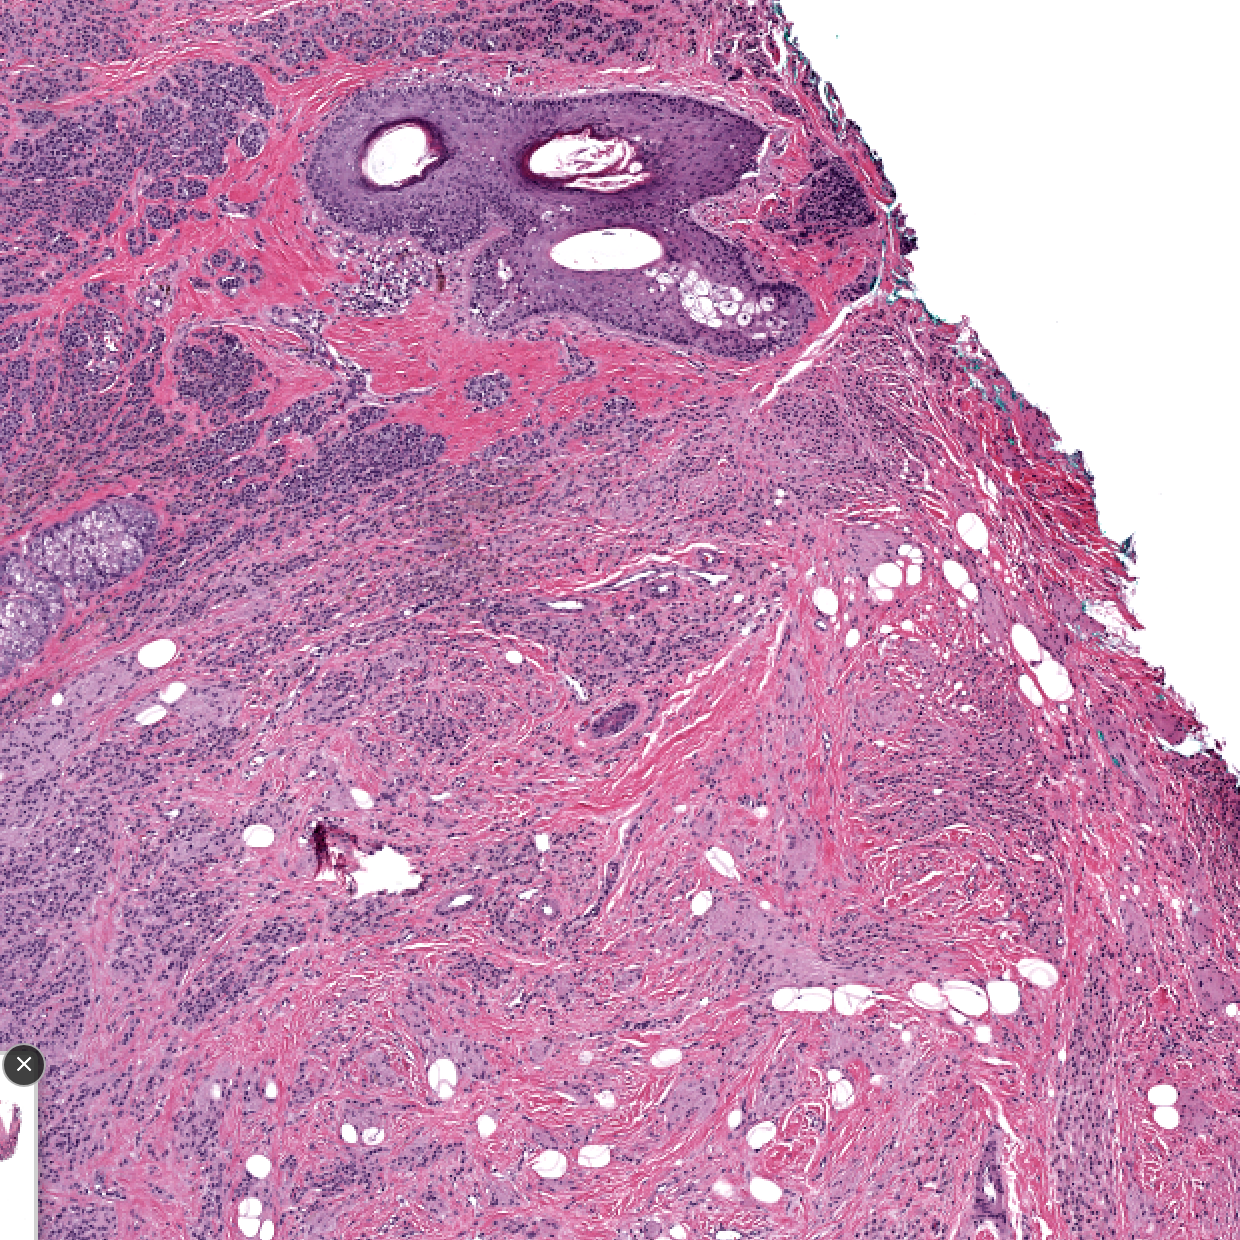
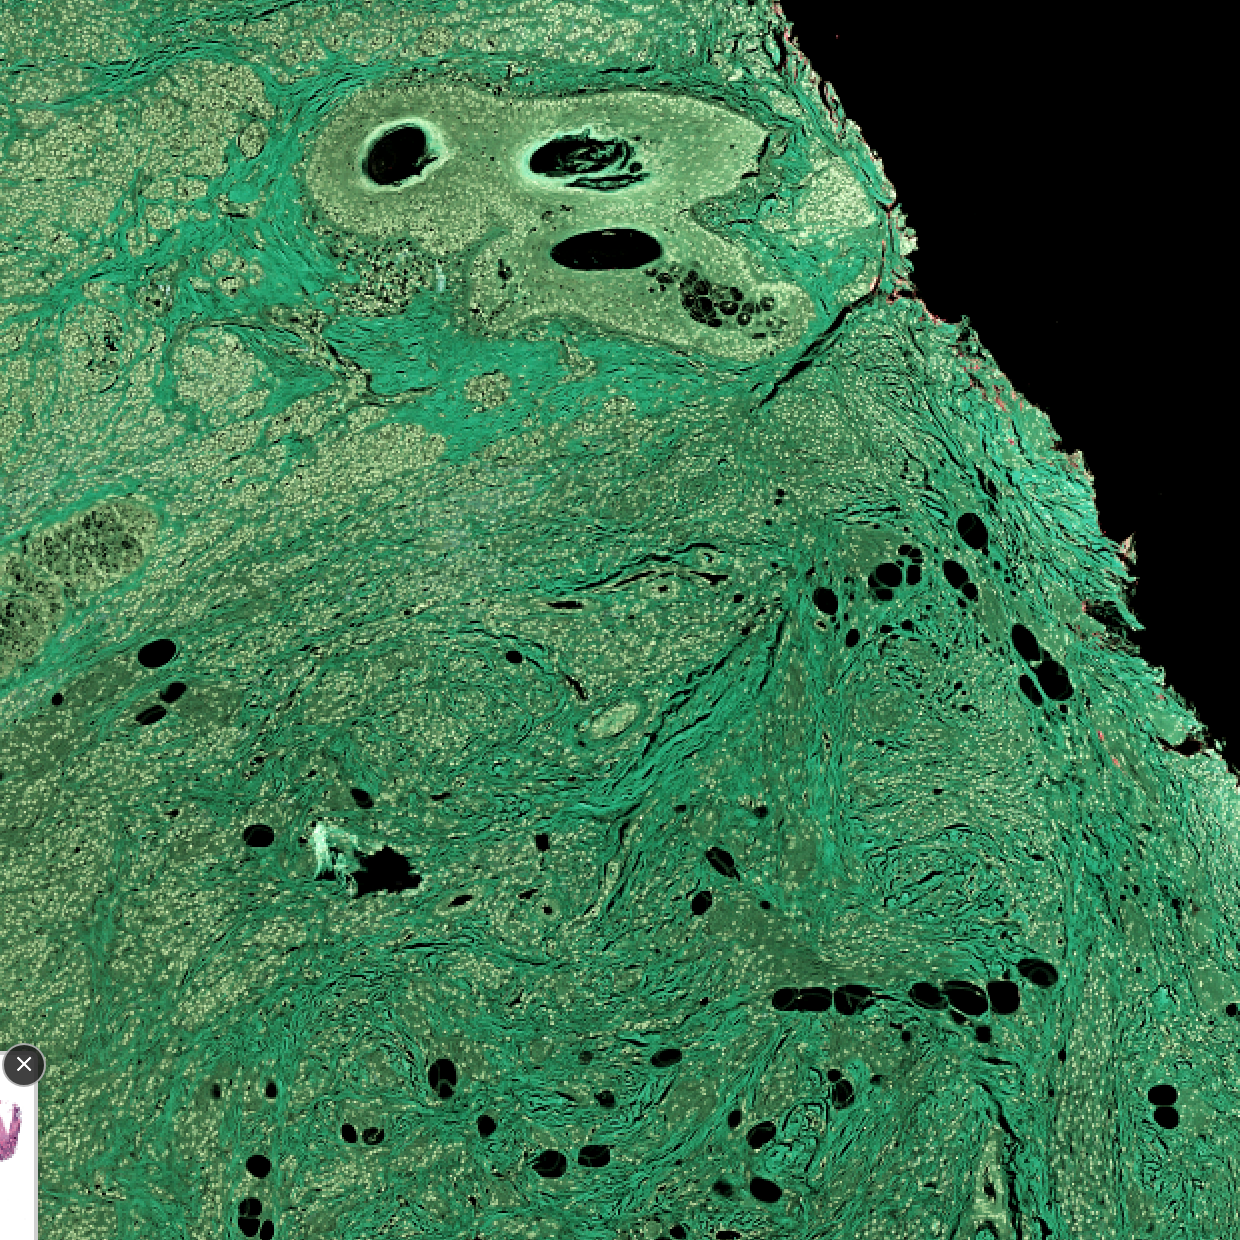
Brightfield becomes a negative. An H&E slide is dark stain on a bright background, so inverting it turns the tissue bright and the background dark. Stained regions then read the way fluorescent signal does.
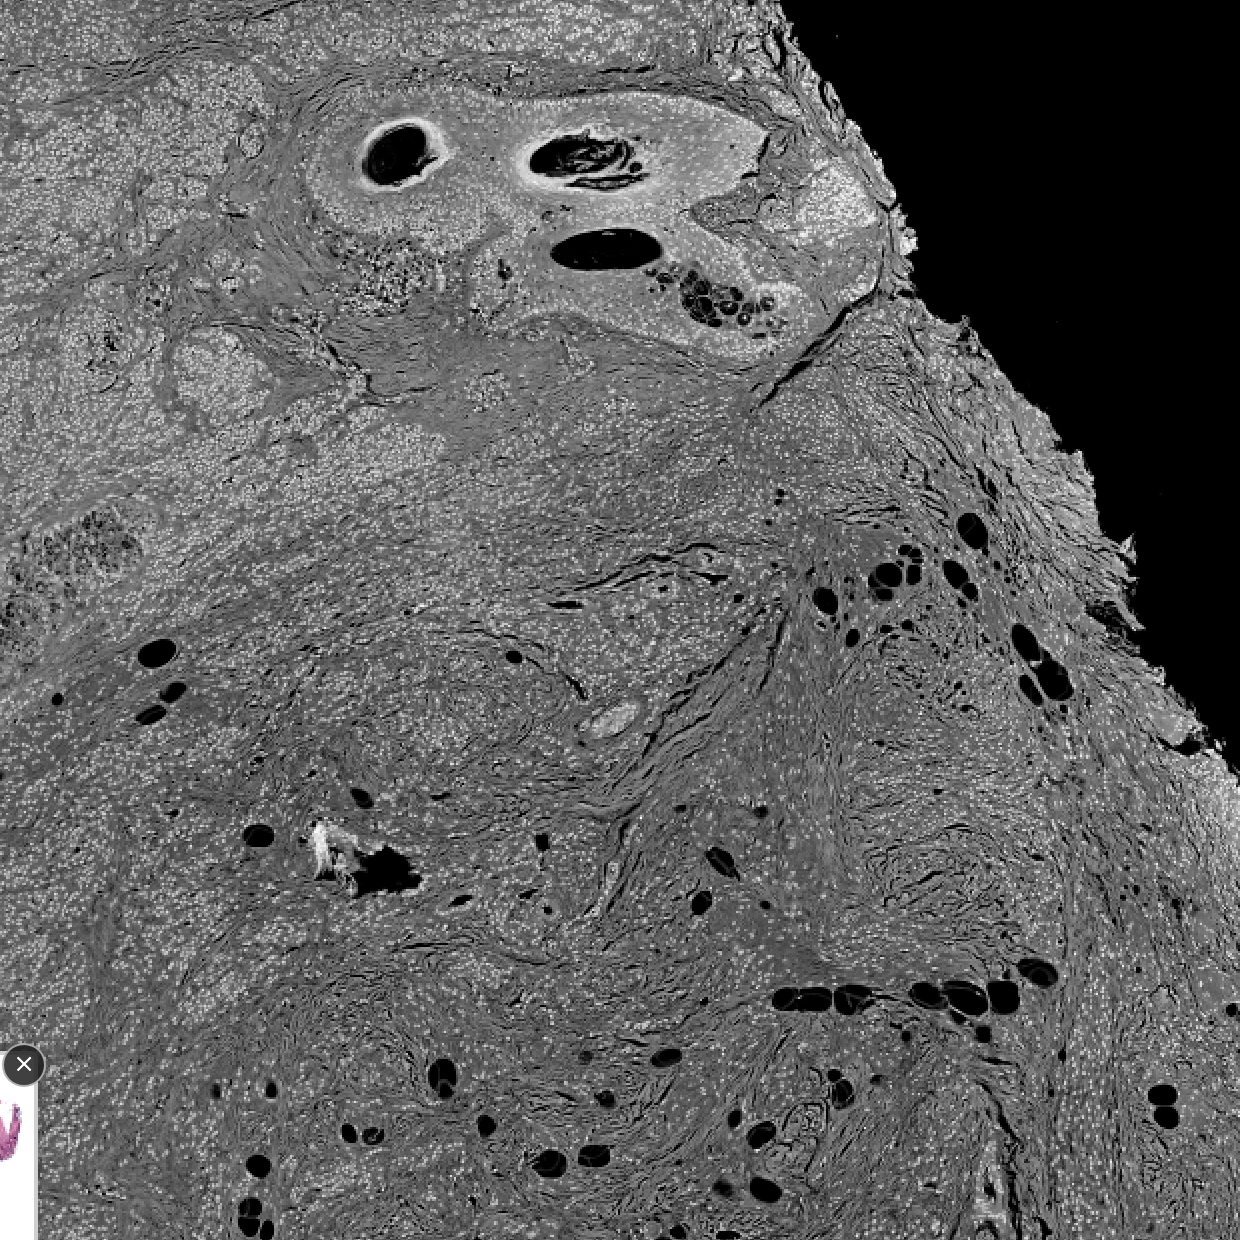
Use INV for:
- Figures headed for print, where a black background wastes ink and reads poorly
- Journals and slide decks that expect dark objects on white
- Reading an H&E slide next to fluorescence without switching mental gears
BW and INV work independently, so you get four combinations. BW + INV gives the classic dark cells on white.
Auto-contrast details
Clicking AUTO on a channel runs percentile-based auto-contrast. The math:
- Sample the channel's currently-loaded tile data (whatever's visible at the current zoom).
- Compute the 2nd and 98th percentiles.
- Set the contrast min to the 2nd percentile and max to the 98th.
The viewer keeps a cache so repeated AUTO clicks on the same zoom don't recompute. Moving to a new region and re-clicking AUTO recomputes for the new visible data.
A single-click all channels shortcut lives in the toolbar. Look for the "Auto" icon on the Channels panel header; it bumps every channel with one press.
Persistence
Colors, min/max, gamma, visibility, and the RGB/BW/INV toggles all persist in two places:
- The URL query string (
?channels=0:on:00FF00:12:234,1:on:FF0000:50:890...) for reviewer handoff via link. - IndexedDB in your browser, keyed by image URL, so re-opening the same image without a URL state still restores your last configuration.
The URL form is compact and human-readable; you can edit it by hand if needed (for batch image opens with pre-set channels, for example).
Keyboard
| Key | Action |
|---|---|
1–9 | Toggle channels 1–9 on / off |
0 | Toggle channel 10 (if present) |
A | Auto-contrast all visible channels |
Image credits
The screenshots on this page use a whole-slide H&E section, a high-content screen and a plate from public collections. See Sample Data and Credits.
Related guides
- Labels Guide: segmentation overlays use channel colours for consistency
- Analytics & Phenotyping: per-object coloring sits on top of label + channel rendering
- Sharing Views: channel state is in the URL; sharing a view sends the exact contrast + colors