Z-Projection
A Z-stack is a set of focal planes through a specimen. Scrolling them one at a time is how you inspect a volume, but it is a poor way to see a whole structure at once: a nucleus that spans thirty planes is never fully in focus in any single one.
A projection collapses a range of planes into one image by combining them pixel by pixel. Everything in the range contributes, so the object appears whole.
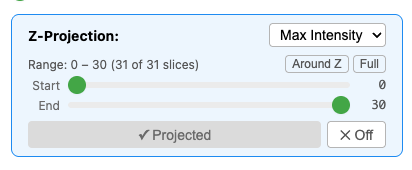
Which projection answers which question
Each mode answers a different question. The right one brings out detail a single plane cannot show.
Maximum takes the brightest value at each pixel across the range. This is the default for a reason: fluorescent objects are bright against a dark background, so the brightest plane at any point is the one where the object sits. Use it for nuclei, puncta, filaments, anything sparse and bright. It is also the least forgiving of noise, because a single hot pixel in any plane survives into the result.
Mean averages across the range. Noise averages down while real signal stays, so this is the one to reach for when the stack is noisy or the signal is faint and spread out. The cost is contrast: a small bright object sitting in five of two hundred planes is diluted by the other one hundred and ninety five.
Minimum takes the darkest value. This is the one for brightfield or phase, where the objects of interest are darker than their surroundings. In fluorescence, reach for maximum or mean instead.
If you are unsure, start with maximum and switch to mean if the result looks grainy.
The same field, both ways
Both of these are the same 51-plane slab, same field, same zoom. Only the mode differs. That is the range the panel offers by default at this plane, so it is what Compute gives you without touching a slider. The mean is shown inverted, the easiest way to read a dim, diffuse result on screen.
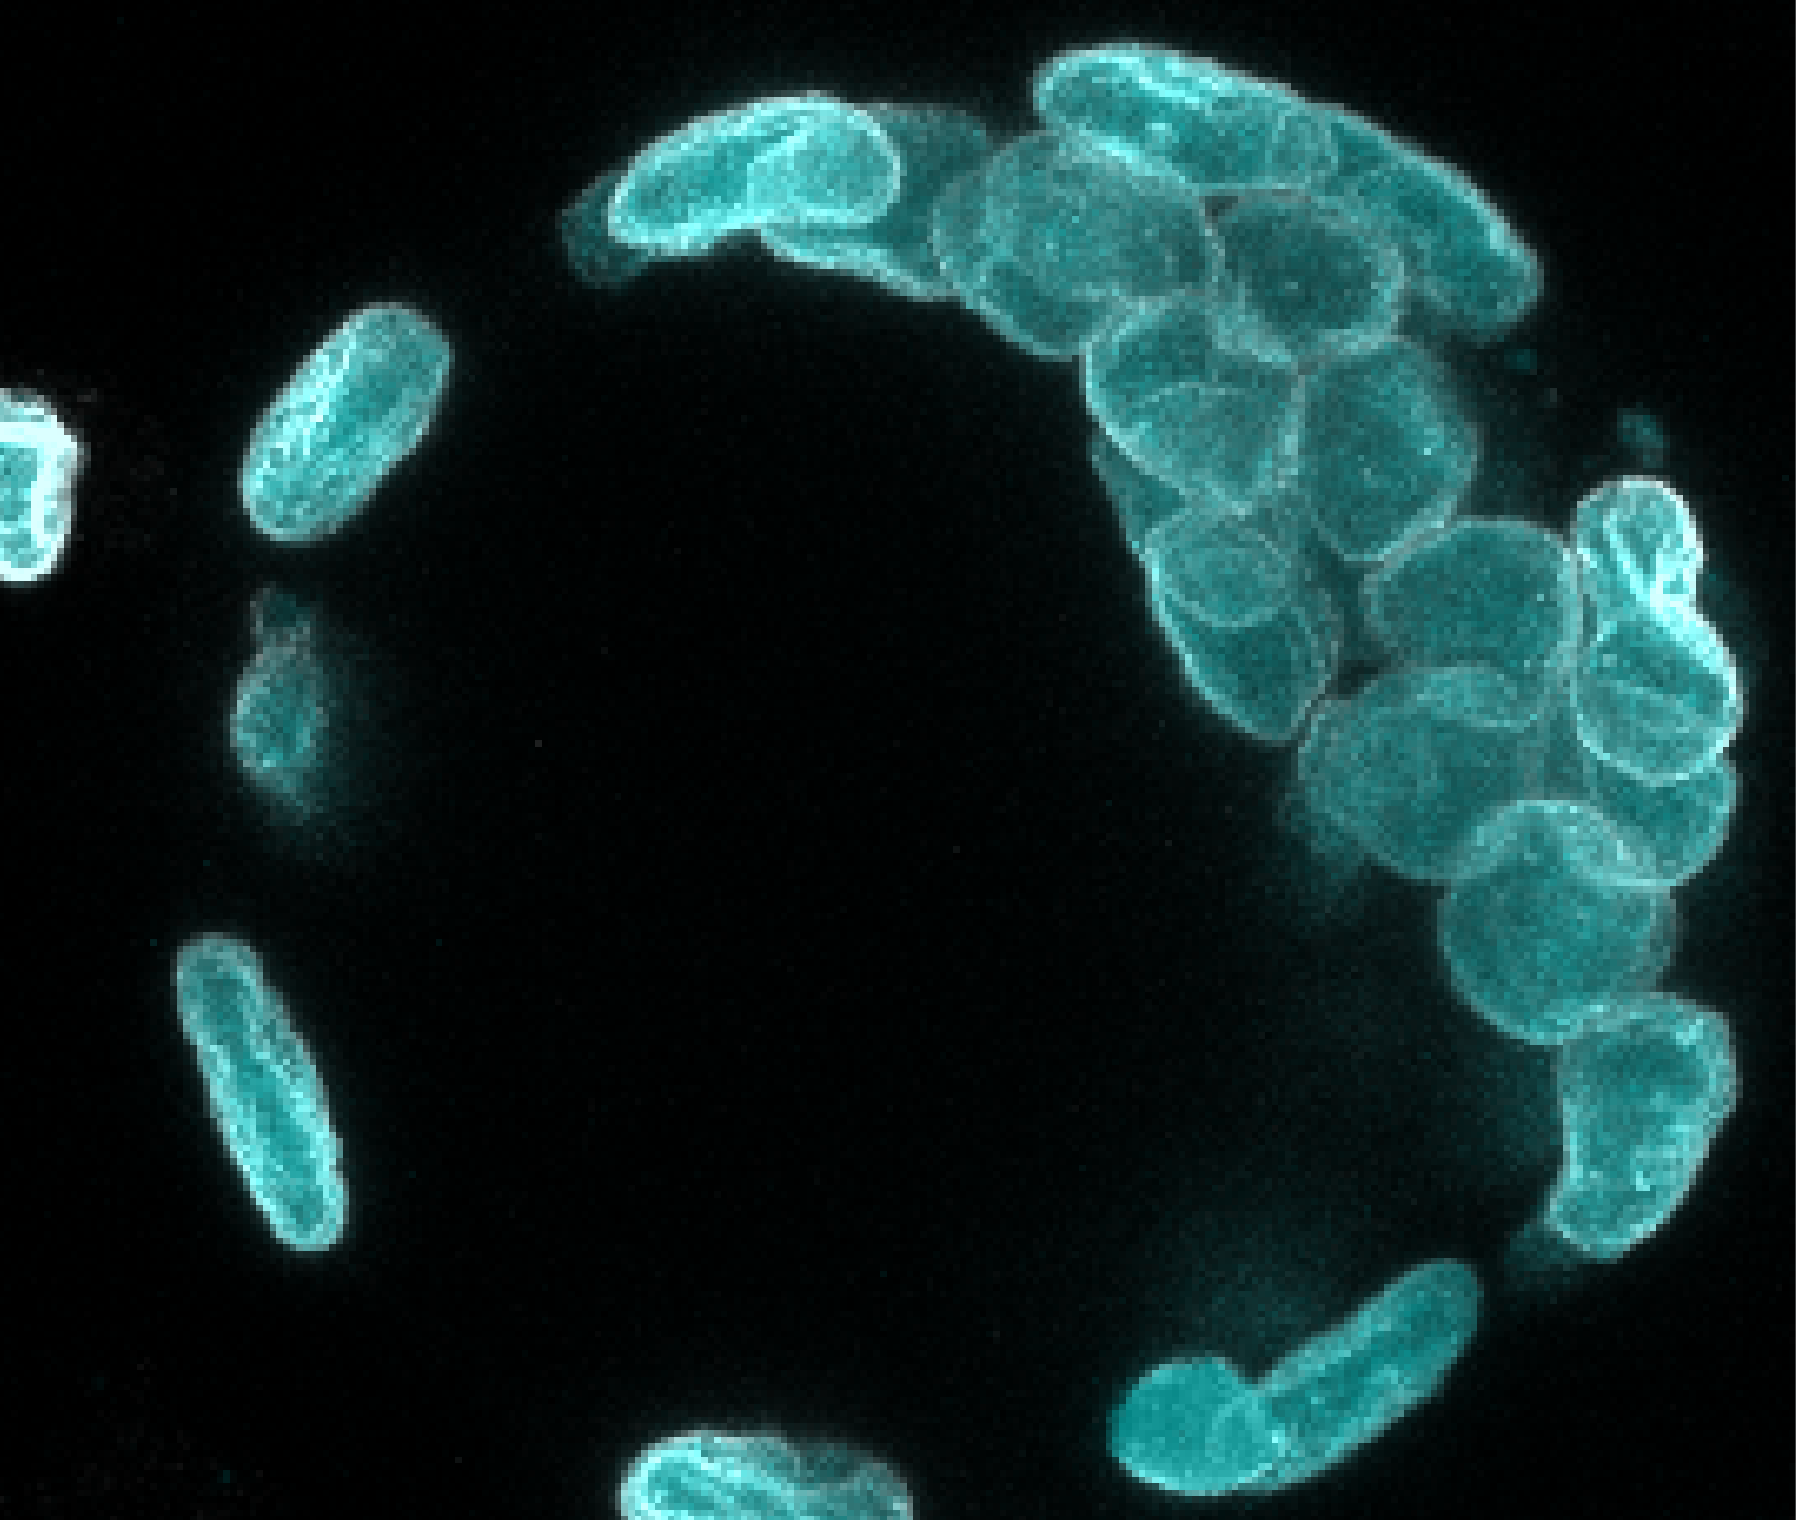
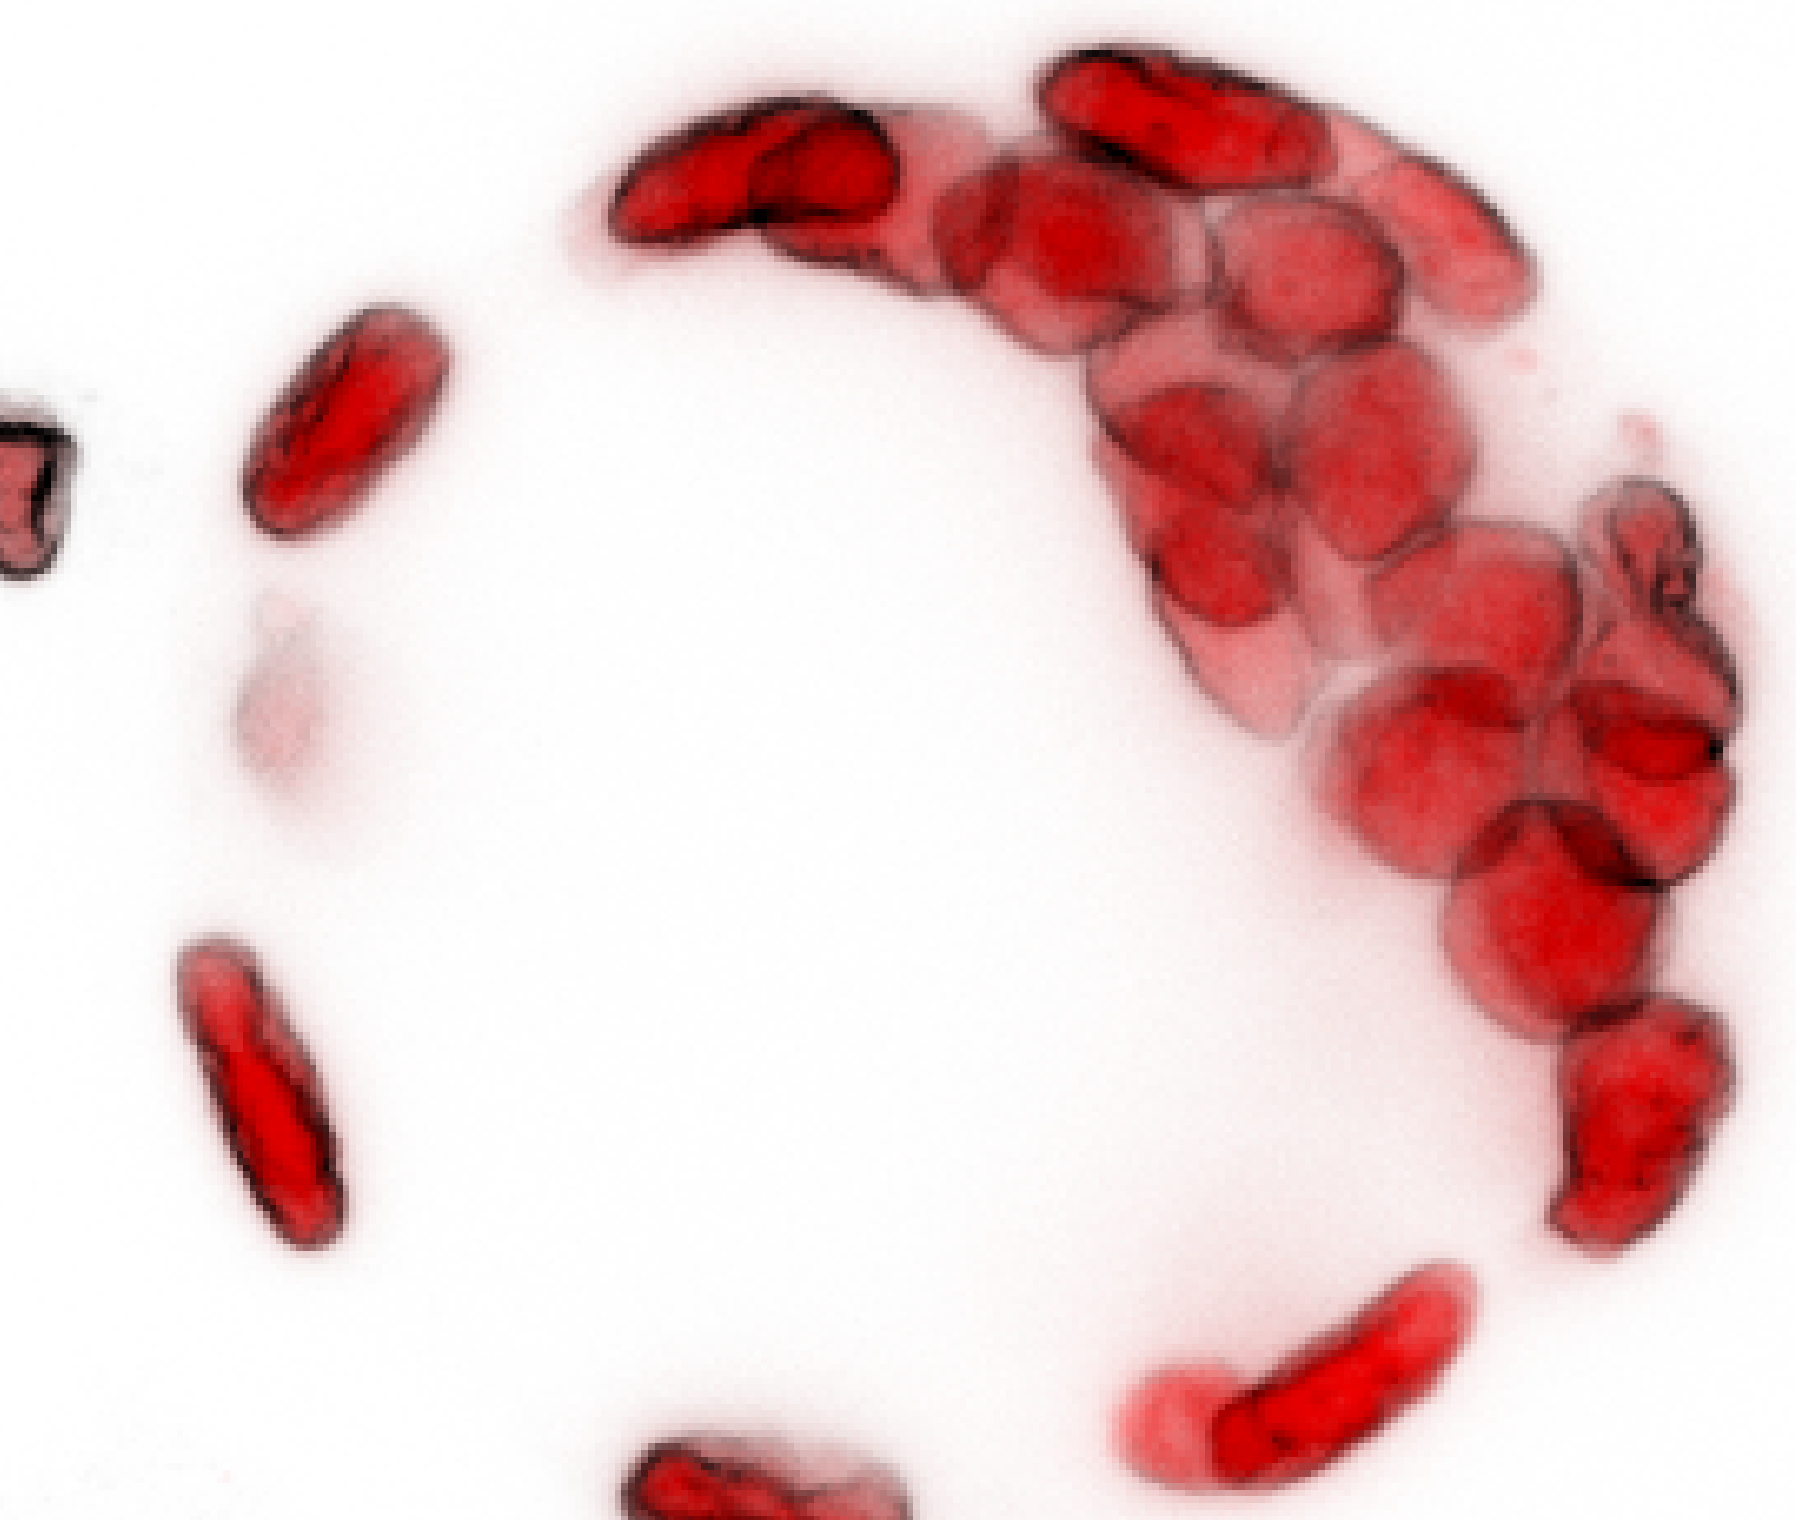
On this dataset maximum wins, and the pair shows why: the nuclei are bright, sparse objects against a dark background, which is exactly what maximum is for. Reach for mean when the signal is faint and spread out and the noise is what you are fighting.
Both links carry the mode and range in the URL, so anything you set up here can be handed to someone else exactly as you see it.
Choosing the Z-range
A tighter range is usually the better choice. A cell monolayer sitting in the middle of a two hundred plane acquisition gains everything from the planes it actually occupies, and waits on the empty ones above and below.
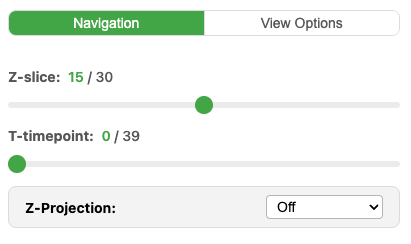
The panel starts on Off. Pick a mode and the range sliders and the compute button appear, with the range already covering twenty five planes either side of the plane you are on.
Three ways to set the range:
- Drag the Start and End sliders to any range you like.
- Around Z resets the range to that default, recentred on whichever plane you are on now and clamped to the ends of the stack. This is the fastest way to project just the part you are already looking at.
- Full returns to the whole stack. It only appears on stacks of 200 planes or fewer. Above that the button is gone and the sliders are the only way, which is what the worked example below runs into.
Changes are not live
Adjusting the mode or the range stages the change. Nothing is recomputed until you press Compute. Once it has run the button reads Projected and greys out, so the label tells you whether what you are looking at is up to date. Press Off to drop back to single-plane viewing. This is deliberate: on a large stack, recomputing on every slider movement would make the control unusable.
Large stacks
Projection is computed in the browser over every plane in the range, so cost grows with the number of planes.
| Planes in range | What the viewer tells you |
|---|---|
| Up to 100 | nothing, it is fast |
| 101 to 200 | "May take a moment to compute" |
| Over 200 | a warning that it may be slow or time out, with a suggestion to narrow the range |
The warnings are advice, not a block: you can project the full stack anyway. But if you are on a remote dataset over a slow connection, every plane in the range is chunks that have to arrive first, and Around Z will usually get you the same biological answer in a fraction of the time.
The control appears for any image with more than one Z-plane.
A worked example
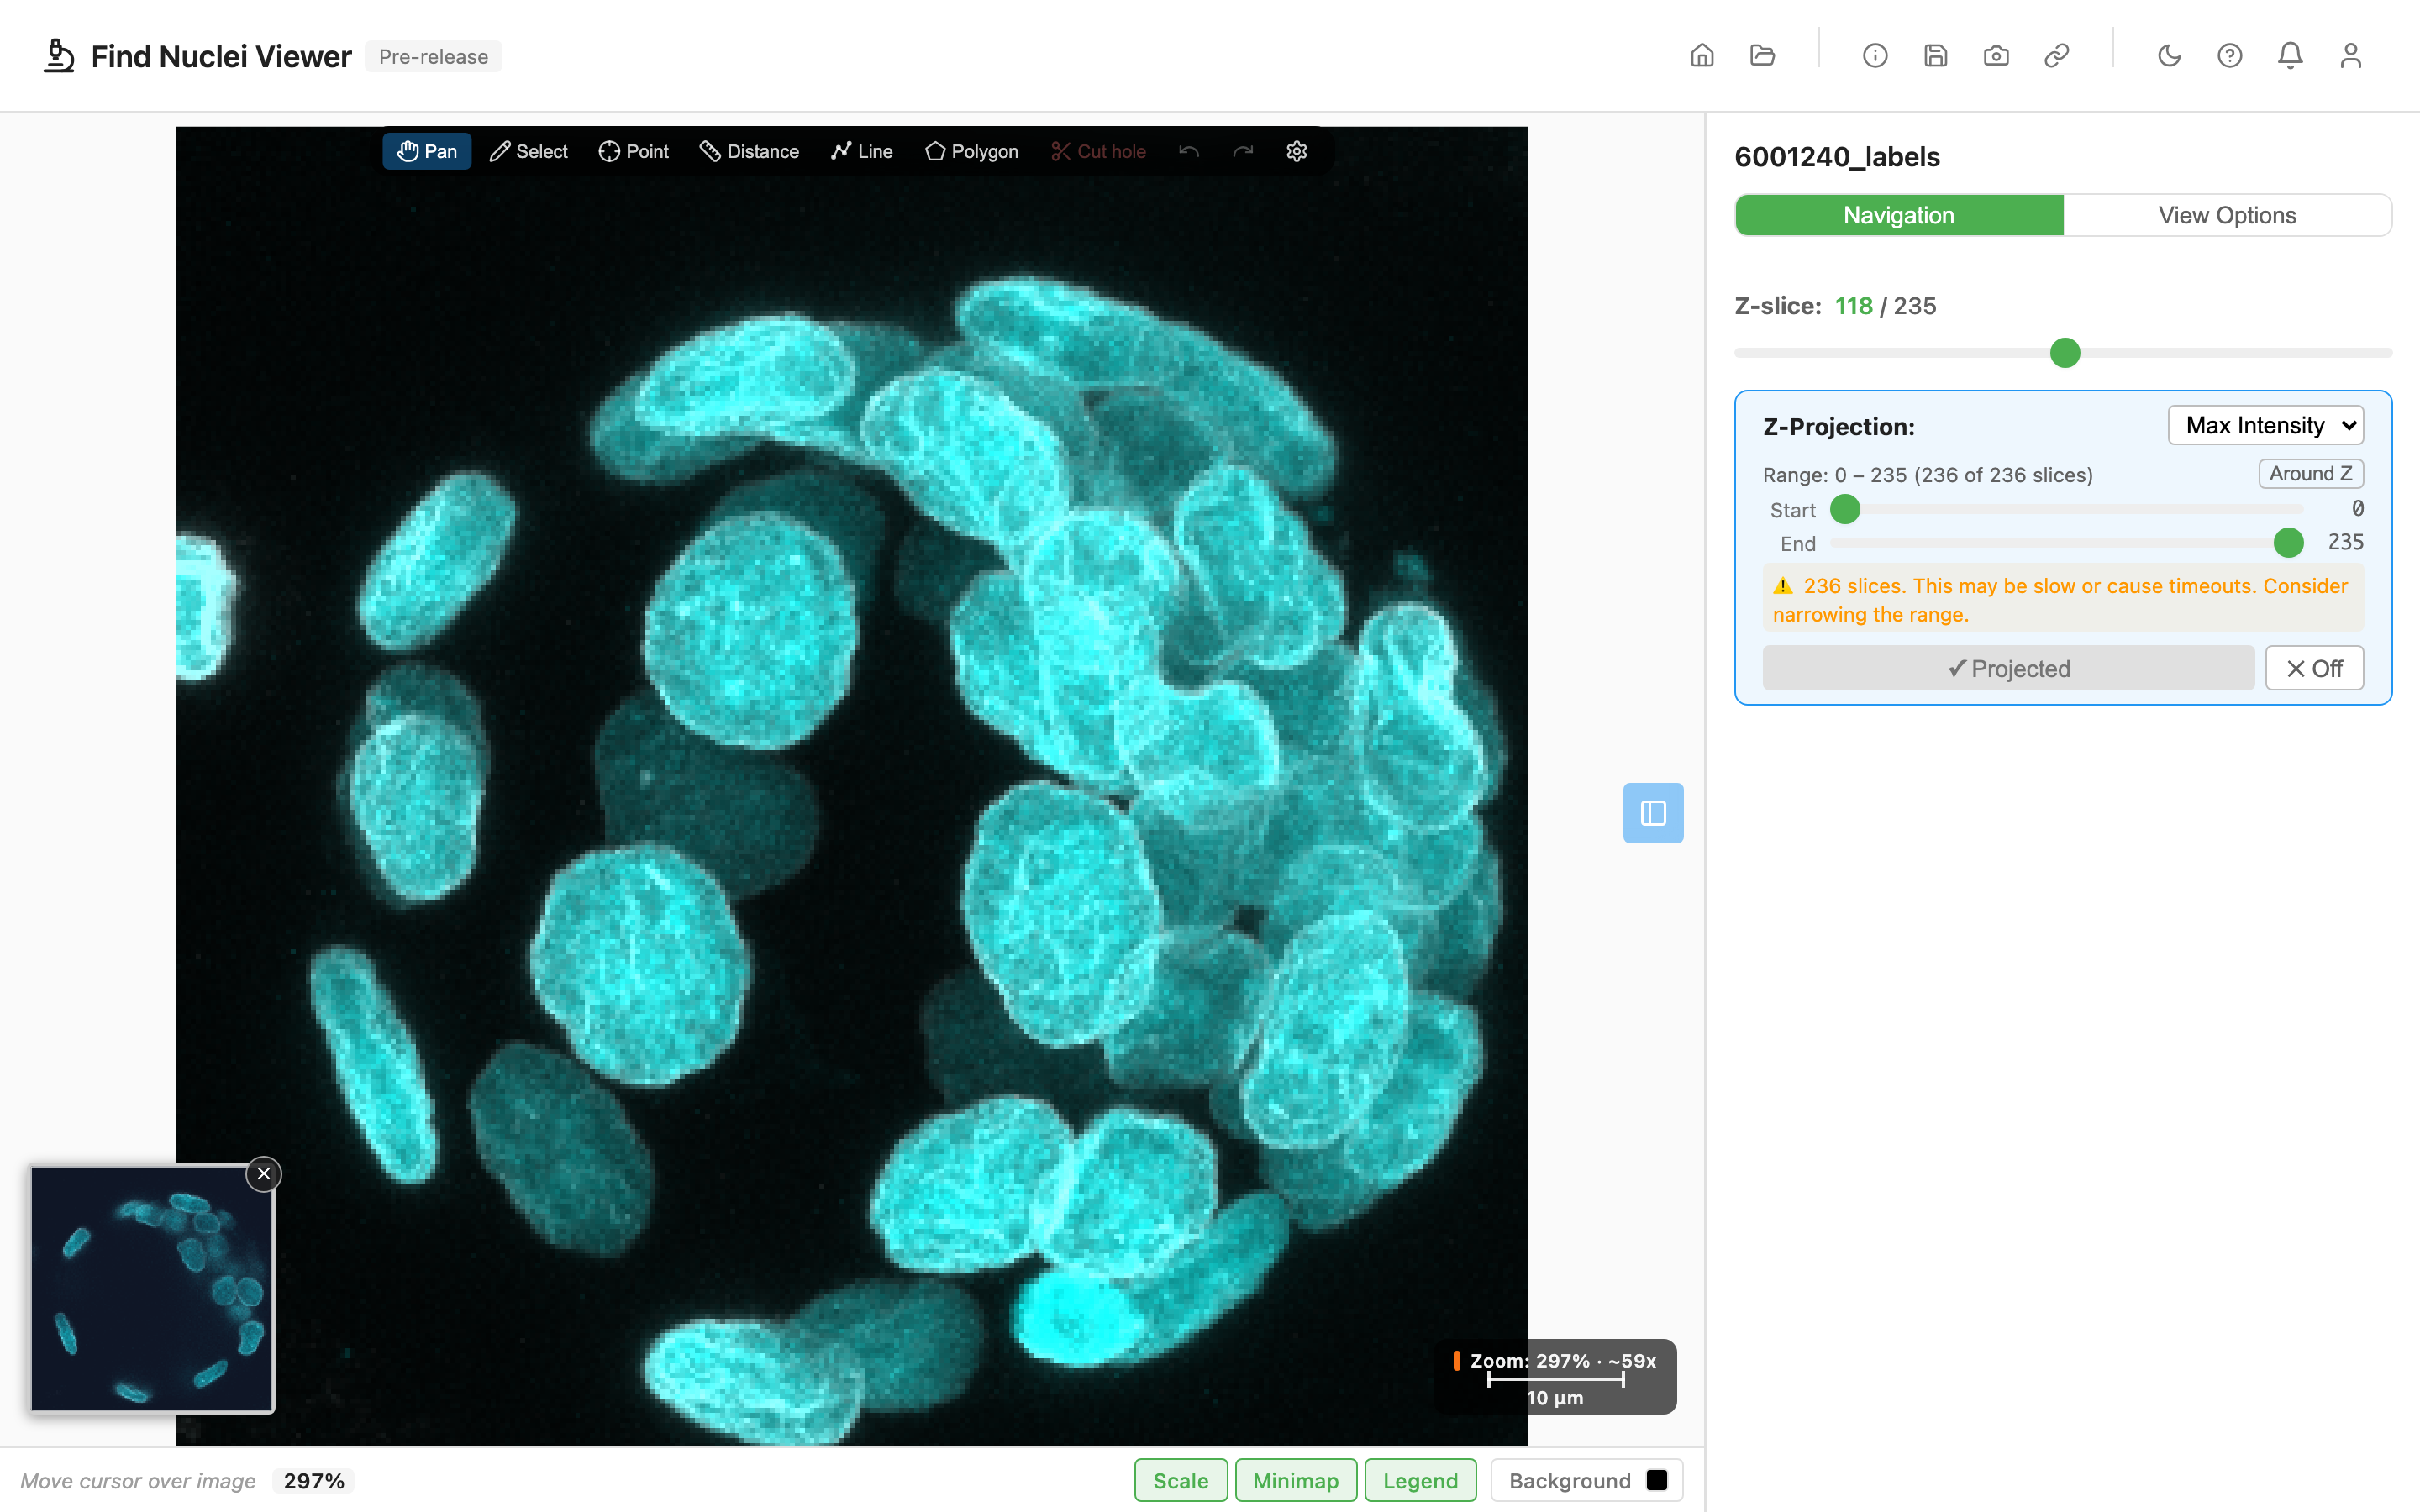
Open the 6001240 stack in the viewer, with both channels already set to the colours and intensity windows used in the screenshot above. It is a confocal stack of nuclei, 236 planes deep, and it shows the difference clearly. It is in the Examples gallery too, as "6001240 Labels".
The link sets the projection to off on purpose, so it opens on a single plane. That is the point of step one.
- Let it load and look at the Z-slider. You are on one plane out of 236, and most nuclei are cut through the middle or out of focus entirely.
- Drag the Z-slider slowly. Individual nuclei come into focus and drop out again. This is the volume you are trying to see all at once.
- Set Z-Projection to Max Intensity. The range appears, already covering fifty one of the 236 planes. Press Compute. Every nucleus in that slab is now whole and in focus.
- Now try the whole stack: drag Start to 0 and End to 235. A warning appears, because 236 planes is over the recommended range. Press Compute again. It takes noticeably longer, and nuclei from every depth are now piled on top of each other. This is the state in the screenshot above.
- Press Around Z to snap back to fifty one planes, then Compute. It computes far faster, and for counting nuclei in one layer it is the better view, because nuclei from other depths are no longer overlapping the ones you care about.
- Switch to Mean and press Compute. The image is smoother and dimmer. On this dataset maximum is the better choice, which is exactly the comparison worth making on your own data.
Step five is the habit worth keeping. Projecting everything is the obvious move and rarely the useful one.
Related guides
- Channels: contrast and colour, which interact with how a projection looks
- Getting Started: Z-stack navigation and the rest of the viewer
- Sample Data and Credits: where the example datasets come from