Exchanging Annotations
Bring annotations in from other tools, send them back out, and share them with a link.
| Format | File | Made by | Import | Export | Opens on |
|---|---|---|---|---|---|
| GeoJSON | .geojson | QuPath, Find Nuclei | Yes | Yes | Any image |
| OME-XML ROIs | .ome.xml | OME tools, Find Nuclei | Yes | Yes | Any image |
| Aperio XML | .xml | Aperio ImageScope | Yes | No | Any slide, made for SVS |
| ASAP XML | .xml | ASAP, CAMELYON16 and CAMELYON17 | Yes | No | Any slide |
| Hamamatsu NDPA | .ndpa | Hamamatsu NDP.view | Yes | No | NDPI slides only |
Share a Slide With Its Annotations
- Put the slide and the annotation file in storage the viewer can read. See Remote URLs.
- Open the slide by its address.
- In the Annotations panel, click Import, then From web address, and paste the address of the annotation file.
- Click Copy link.
For private storage, see Private Images and Slides. Behind a token, an annotation file opens with the slide's token when both sit on the same server.
The link carries both addresses. Whoever opens it sees the slide with the annotations. Nothing is saved for them until they edit.
Import
In the Annotations tab, click Import, then From file or From web address. The viewer reads:
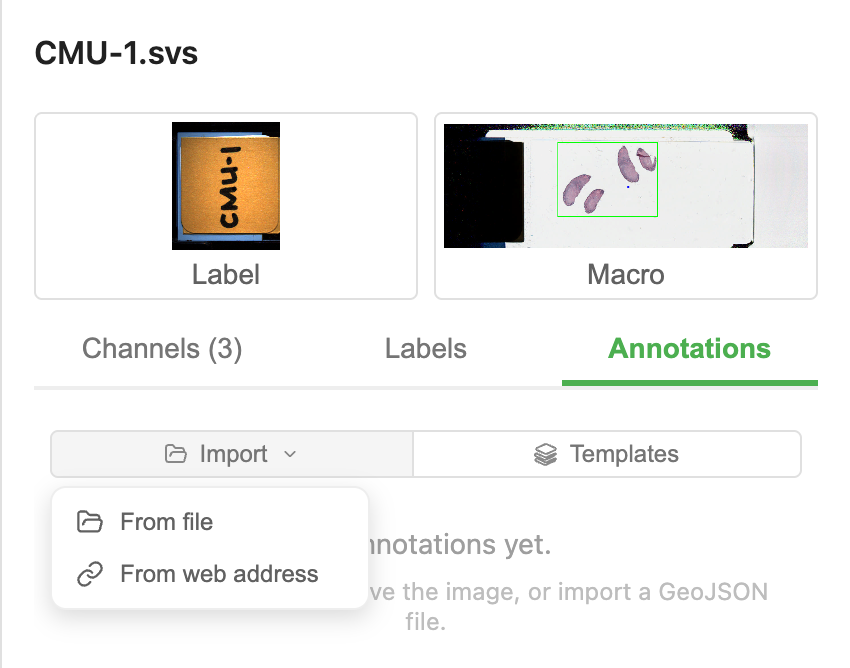
GeoJSON, including QuPath exports (
.geojson).OME-XML ROIs (
.ome.xml).Aperio ImageScope annotations (
.xml), for SVS slides.ASAP annotations (
.xml), as in the CAMELYON16 and CAMELYON17 challenges.Hamamatsu NDP.view annotations (
.ndpa), for NDPI slides. Open the NDPI first: the file stores positions on the glass, and the slide says where it was scanned.Imported shapes show as a contour. Turn on the fill for one shape in the panel.
Class names and colours come from the file.
A class with no colour gets one colour for the whole class.
Each import adds to the shapes on the slide, so several files can sit together. The same file twice adds nothing. Clear empties the slide.
Export
Export GeoJSON and Export OME-XML write the shapes in the slide's own pixels, at full resolution.
The GeoJSON is the layout QuPath writes, which 10X Genomics Xenium Explorer reads too. See Other Tools.
Other Tools
QuPath
Annotations go both ways, tested with QuPath 0.5.
- From QuPath: File › Export objects as GeoJSON, then import the file here.
- Into QuPath: export GeoJSON here, then drag the file onto the slide in QuPath. Shapes, classes and colours come through.
10X Genomics Xenium Explorer
Our GeoJSON has the layout 10X Genomics documents for import into Xenium Explorer 4.1 and later: Selecting multiple regions of interest. It lists GeoJSON from a third-party tool such as QuPath as a use of its Import button. Click Import there and pick the file.
- Regions only. Xenium Explorer takes closed shapes. Lines and points are left out.
- The same image. Draw on the morphology image or the post-Xenium H&E, so the shapes land in the right place.
- Classes show as labels in its Annotations layer.
Aperio ImageScope
Pens, rectangles, ellipses, arrows and rulers open with their names, descriptions and attributes. Import only.
ASAP
The outlines of the CAMELYON16 and CAMELYON17 challenges, and other sets drawn in ASAP, open on their slides. Polygons, splines, rectangles, dots, point sets and measurements come in. Each group becomes a class, in the group's colour. Import only.
Try it on a public CAMELYON16 lymph node slide. This link opens the slide and the pathologists' two tumour outlines, straight from AWS Open Data:
tumor_001.tif with its tumour outlines
ASAP draws splines as smooth curves. The viewer joins the same points with straight lines, so a spline with few points looks a little more angular here.
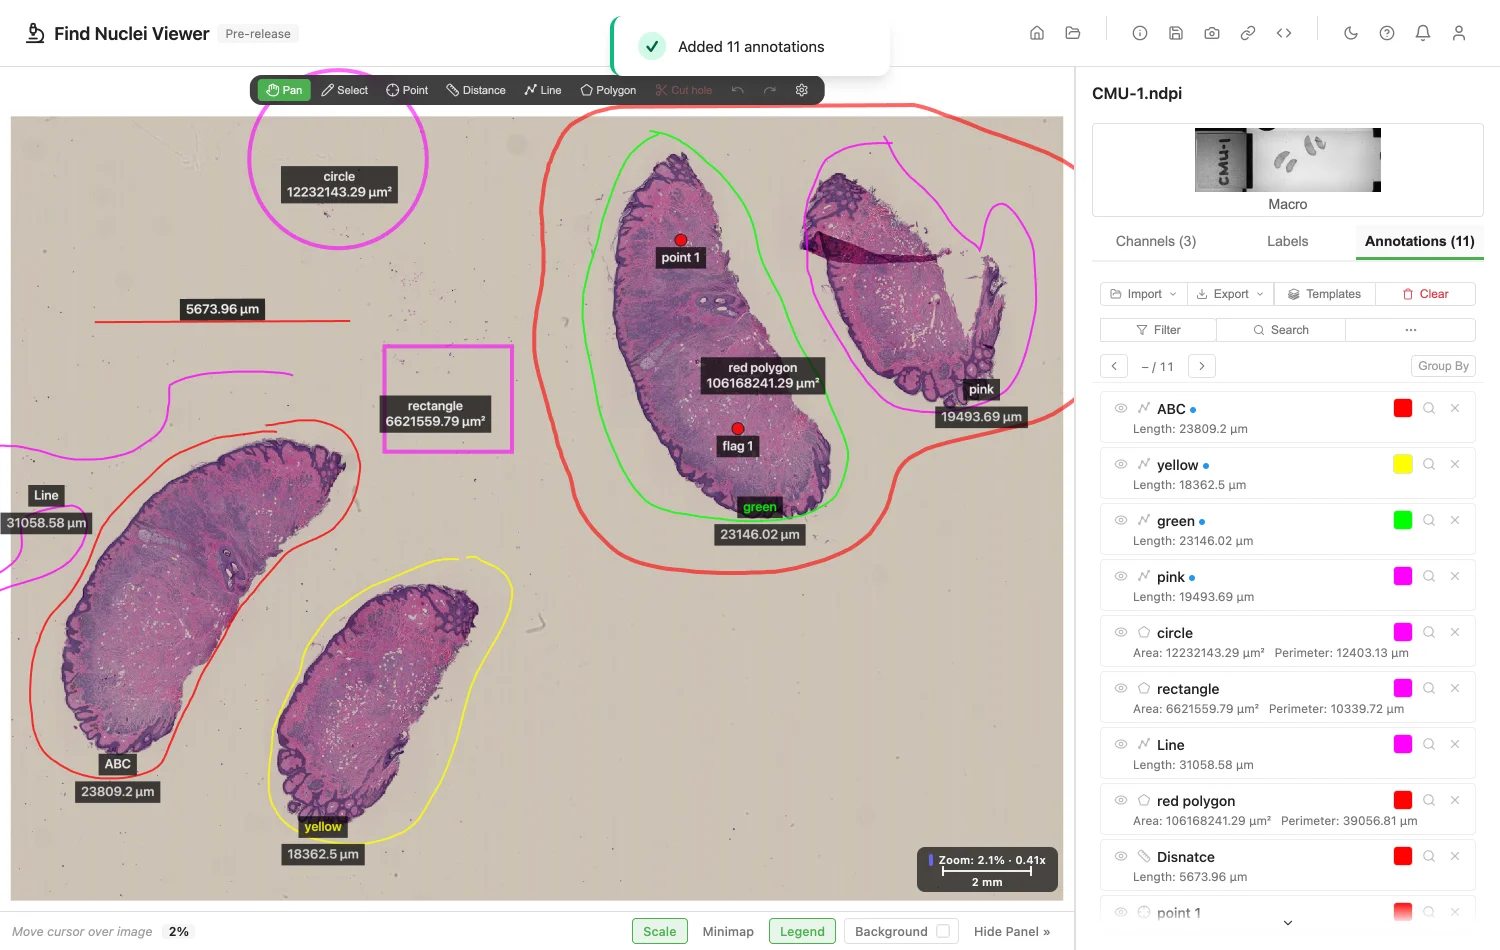
Hamamatsu NDP.view
Every NDP.view2 tool opens: freehand lines and regions, rectangles, circles, rulers, pointers, pins and flags, with their titles, details and colours. Import only.
Visiopharm
Annotations go both ways, by the formats the Visiopharm manual lists under Layer Data.
- Into Visiopharm: export GeoJSON here, then import it in Visiopharm as QuPath GeoJSON.
- From Visiopharm: export the labels as GeoJSON for Xenium Explorer (File › Export › LayerData), then import the file here. Only label objects travel this way, such as segmented cells (release notes).
A file of many cells opens what the viewer can draw and tells you about the rest. See Cell Detections.
Cell Detections
A file with many detected cells opens its annotations and shows a message about the rest. To see large detection results, use analysis results.
Coordinates
Coordinates are pixels at full resolution. On .mrxs they start at the top-left of the area holding images, as in QuPath.
Image credits
The screenshot uses CMU-1.ndpi from the OpenSlide test data, CC0, with an annotation file drawn for this guide in NDP.view2. The ASAP example uses CAMELYON16 tumor_001, CC0. See Sample Data and Credits.